The 2026 Monsoon, by the Numbers
The official rain gauge at the airport finished the season almost exactly at normal, but the rain came in the wrong order. Across southern Arizona, the weather service issued more flash-flood warnings than in any year since at least 2002. And heat-related deaths passed last year's total by early September.
The monsoon season ended Wednesday. Here is what the 2026 season looked like, measured, from the airport's official record, Pima County's rain gauges, the National Weather Service and the Pima County Medical Examiner.
A normal season, in the wrong order
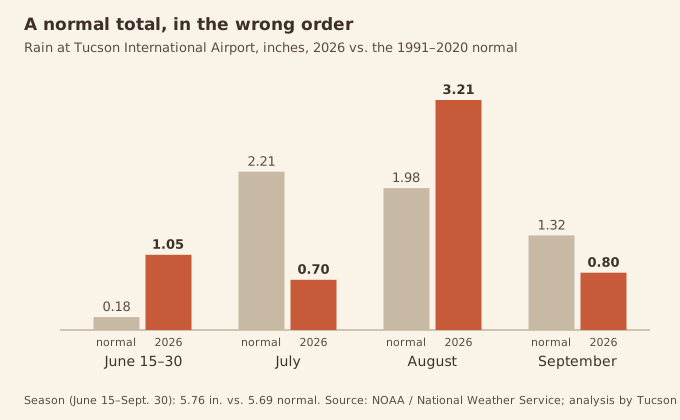
Tucson International Airport, the city's official weather station, recorded 5.76 inches of rain from June 15 through Sept. 30. The 1991–2020 normal for the season is 5.69 inches. Out of 79 seasons in the airport's record going back to 1948, 2026 ranked 41st, close to the middle.
The total hides the shape. The season started early and wet: 1.05 inches fell in the last two weeks of June, when 0.18 is normal, the sixth-wettest end of June on record. Then July, usually the heart of the monsoon, brought 0.70 inches against a normal of 2.21, the eighth-driest July. August made up the difference with 3.21 inches, the 16th-wettest. September came in at 0.80 inches, a bit under its 1.32-inch normal, and near the middle of the record. The season's wettest day at the airport was Aug. 31, with 0.84 inches.
The airport isn't your neighborhood
The airport is one point on the map, and this year it was a dry one. Pima County's Regional Flood Control District runs a network of rain gauges across the county. In the 30 days ending at midnight Sept. 30, 112 of the 126 county gauges reporting recorded more rain than the airport's 0.80 inches.
The White Tail Campground gauge in the Catalinas recorded 7.91 inches over those 30 days. Avra Valley Air Park recorded 5.20, Florida Canyon in the Santa Ritas 5.12, and Picture Rocks and Brawley Wash at Milewide Road 4.96 each.
Tucson Daily Brief began archiving the county's gauge readings hourly on Sept. 9, so these gauge comparisons cover September, not the whole season. You can see current readings on our Life in the Desert page.
A record number of flash-flood warnings
The National Weather Service office in Tucson issued 246 flash-flood warnings this season, according to the Iowa Environmental Mesonet's archive of the office's warnings. That is more than in any year since the archive begins in 2002. The previous high was 172, in 2021. Of the 246, 117 covered part of Pima County.
That count measures warnings issued, which reflects how forecasters warn as well as how much it rained. The office also issued 289 severe-thunderstorm warnings, 200 flood advisories and 28 dust-storm warnings during the season.
Rescues followed. The weather service's storm reports logged 35 water rescues in Pima County this season. On the morning of Sept. 1, 19 children and a bus driver were rescued from Brawley Wash at a low-water crossing on Manville Road, according to the report.
The busiest stretch came in mid-September. From Sept. 11 to 16, the office issued 35 flash-flood warnings, 22 of them covering part of Pima County.
The season's last storm came from the remnants of Hurricane Polo. Polo was a Category 1 hurricane approaching Guaymas, Sonora, on the morning of Sept. 29, according to the National Hurricane Center, and had weakened to a tropical storm by that afternoon. A flood watch covered all of southeastern Arizona from Sept. 28 through the night of Sept. 29. That day, seven flash-flood warnings covered parts of Pima County. Storm reports logged impassable washes on State Route 86, flooding on westbound Interstate 10 near Camino Adelante and a swift-water rescue northeast of Green Valley. A storm report from 4 miles west-northwest of Summerhaven logged 4.29 inches by early afternoon, with rain still falling.
The rivers ran, but well short of their records. The Santa Cruz River near Cortaro peaked at 5,090 cubic feet per second on Aug. 13, according to provisional U.S. Geological Survey data. Its record is 65,000, set in 1983. Lightning was below average: Pima County recorded 41,932 cloud-to-ground strikes during the season, against a 1990–2025 average of 53,834.
The heat
The airport recorded 77 days at 100 degrees or hotter this year through Sept. 30. The 1991–2020 average for a full year is 68. Only seven years since 1948 had more; the record is 112, set in 2024.
The first 100-degree day came on March 19, the earliest on record. The previous earliest was April 11, 2025. The hottest day of the year was Aug. 1, at 110 degrees.
Overnight lows ran high, too. On 27 nights, the temperature at the airport never dropped below 80 degrees, the fourth-most on record. The warmest low of the year was 86 degrees, on Aug. 2. The Tucson area was under an extreme-heat warning on 26 days of the season, including a 13-day stretch from Aug. 17 to Aug. 29.
Heat deaths
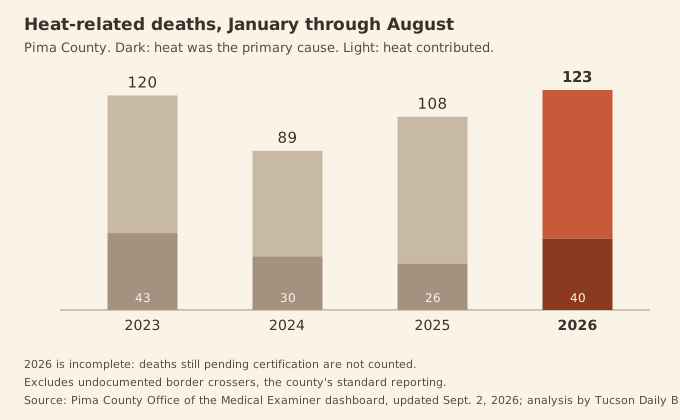
Pima County recorded 123 heat-related deaths this year as of Sept. 8, according to a Sept. 16 memo from the county's Health Department to the Board of Supervisors. That already exceeds the 117 recorded in all of 2025. The memo said 100 more death investigations were still pending and could "take up to 8 weeks to determine if they are heat related."
The county counts a death as heat-related when heat was either the primary cause or a significant contributing factor. Of the 123, the Medical Examiner's dashboard shows heat was the primary cause in 40 and a contributing factor in 83. In 35 of those 83, the primary cause was a drug overdose; in 45, it was natural disease.
Through August, 2026 has the most heat-related deaths of any year since the county began counting heat-contributing deaths in 2023, by the county's standard count, even though August's figure is still incomplete.
More of the deaths are happening indoors. The dashboard counts 58 heat-related deaths indoors this year, already more than the 49 in all of 2025, and 65 outdoors. Thirty-four of the people who died were experiencing homelessness. By month, 35 deaths came in June, 45 in July and 36 in August.
These figures cover deaths in Pima County investigated by the Medical Examiner, and they exclude undocumented border crossers, as the county's standard reports do. Including border crossers, the dashboard shows 149 deaths.
What it means for water
Tucson's long-term supply depends on the Colorado River, not the monsoon. In 2024, 78 percent of the water on Tucson Water's main system was Colorado River water, most of it delivered by the Central Arizona Project and recharged underground, according to the utility's annual water quality report. Lake Mead fell 9.17 feet over the season, from 1,046.97 feet on June 15 to 1,037.80 on Sept. 30, according to the U.S. Bureau of Reclamation. It has been below its July 2022 low since Aug. 6.
Under new federal operating guidelines for the river, Reclamation announced Aug. 21 that deliveries to the Lower Basin states will be cut by 1.25 million acre-feet in 2027. If the Lower Basin states carry out their proposal for sharing that cut, Arizona's share is 760,000 acre-feet.
What's next
The National Oceanic and Atmospheric Administration's Climate Prediction Center gives Tucson 40 to 50 percent odds of a wetter-than-normal October through December, against 33 percent with no signal either way. The center said in September that "El Niño is strengthening, with a greater than 90% chance of a very strong event during the Northern Hemisphere fall and winter 2026-27." At the airport, the first freeze of the fall typically comes around Dec. 1.
How we got these numbers
Airport rainfall and temperatures come from NOAA's daily records for Tucson International Airport, topped up with the National Weather Service's daily climate reports for the last days of September; normals are NOAA's 1991–2020 daily normals. Our copy of the airport record is missing 1947, so rankings cover 1948 through 2026. County rain-gauge totals come from the Pima County Regional Flood Control District's gauge network, which Tucson Daily Brief has archived hourly since Sept. 9; the 30-day totals exclude rain that fell after midnight Oct. 1. Warning counts come from the Iowa Environmental Mesonet's archive of National Weather Service warnings, counted as unique warnings, not individual updates. Rescues and storm details come from the weather service's local storm reports. River peaks are provisional U.S. Geological Survey data. Heat-death figures come from the Pima County Office of the Medical Examiner's heat-related deaths dashboard, last updated Sept. 2, and the Health Department's Sept. 16 memo to the Board of Supervisors. Lake Mead elevations come from the U.S. Bureau of Reclamation.
This is the first of our yearly "State of the Desert" reports. Follow the season as it happens on Life in the Desert.
Reported and written by Nicholas De Leon, with research and drafting assistance from Claude Opus 5.5; published at 12:43 PM MST on October 1, 2026. Read more about how this is made.
Comments
Join the conversation on Bluesky